Data Flow Diagram (DFD) in Software Engineering
Once a system's architecture and overall design have been established, it becomes important to communicate exactly how information actually moves through that system, where it originates, which processes transform it, and where it ultimately ends up being stored or delivered. Written descriptions can quickly become difficult to follow once a system grows even moderately complex, which is exactly why Data Flow Diagrams exist.
A Data Flow Diagram, commonly abbreviated as DFD, is a visual tool that represents the movement of data within a system using a small, consistent set of symbols. Rather than describing control flow or the order in which things happen, a DFD focuses purely on how data flows between different parts of a system, making it easier for both technical and non-technical stakeholders to understand a system's behavior at a glance.
In this tutorial, you will learn the standard symbols used in DFDs, how diagrams are organized into different levels of detail, the fundamental rules that govern valid DFDs, and how to construct one step by step using a practical example.
What is a Data Flow Diagram?
A Data Flow Diagram is a graphical representation of how data moves through a system, illustrating the processes that transform data, the external entities that provide or receive data, the data stores where information is held, and the flows that connect all of these elements together.
Unlike flowcharts, which typically emphasize the sequence and logic of operations, a DFD deliberately avoids showing decision points, loops, or timing. Its purpose is narrower and more focused: to clearly illustrate what data exists in a system and how it travels between different parts of that system.
Why Use Data Flow Diagrams?
- They provide a clear, visual overview of a system that is often easier to understand than lengthy written descriptions.
- They help identify all the data a system needs to handle, along with where that data comes from and where it goes.
- They serve as a useful communication tool between technical teams and non-technical stakeholders during requirement discussions.
- They can reveal missing processes, redundant data flows, or unclear responsibilities early in the design process.
- They provide a foundation that can guide later decisions about database design and system architecture.
basic Element of DFD
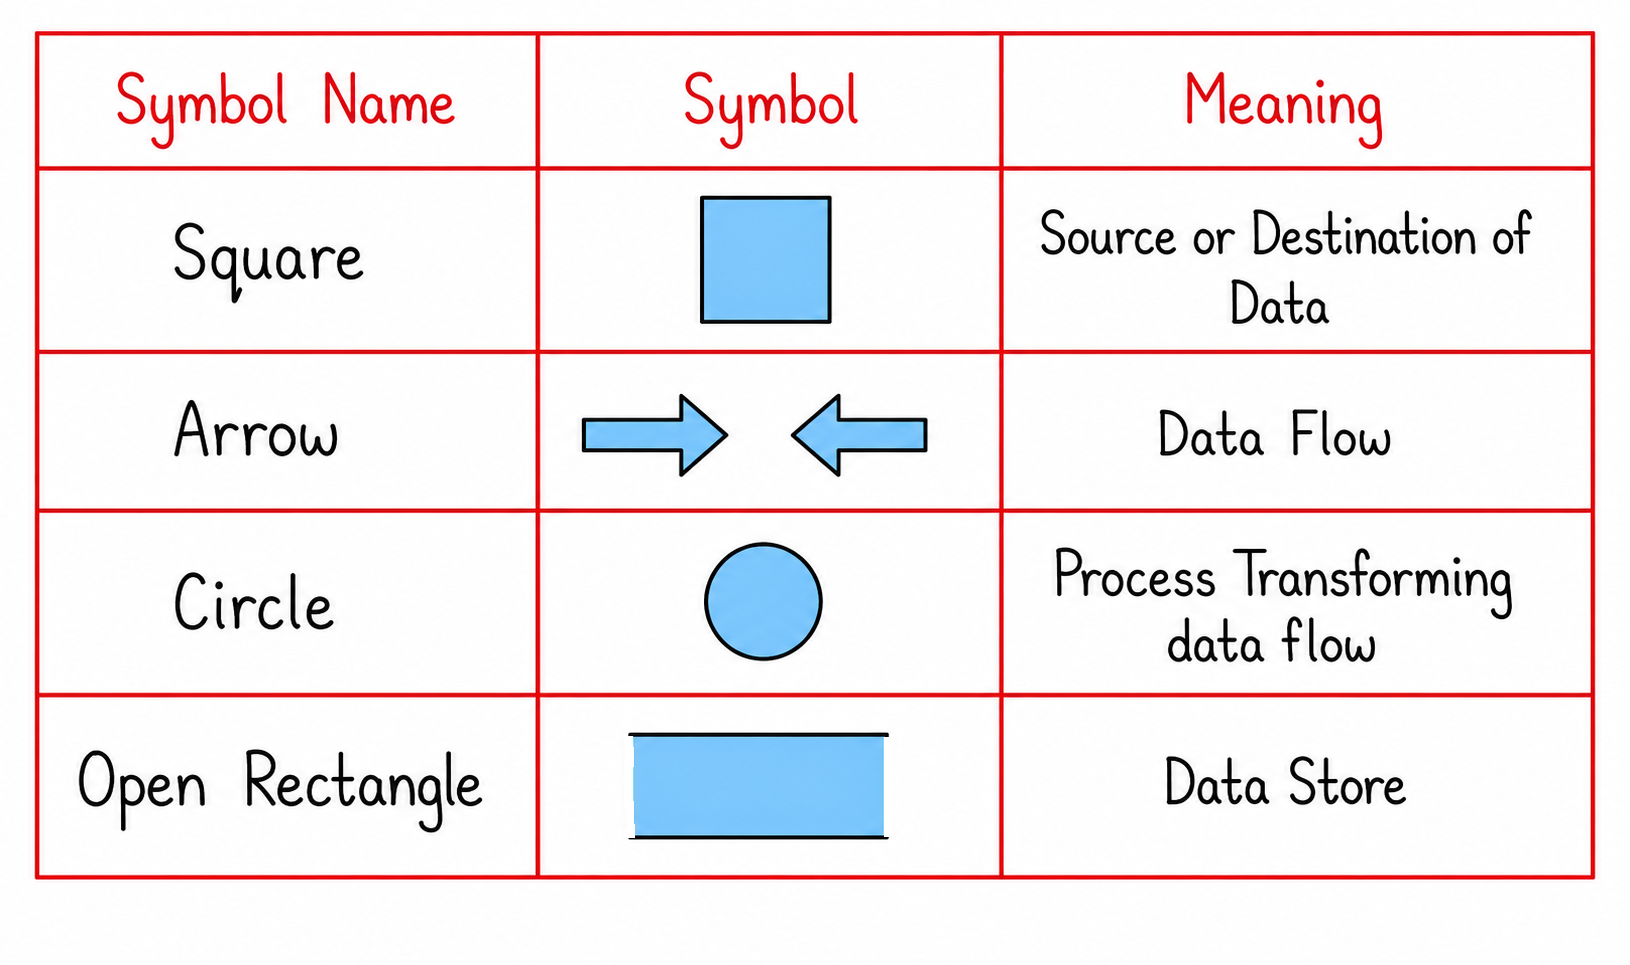
Standard DFD Symbols
Data Flow Diagrams use a small, consistent set of symbols to represent every element within a system. While minor notation styles can vary slightly between methodologies, the four core elements remain largely consistent across most approaches.
| Symbol | Typical Shape | Represents |
|---|---|---|
| External Entity | Rectangle | A source or destination of data that exists outside the system being modeled. |
| Process | Circle or Rounded Rectangle | An activity that transforms incoming data into outgoing data. |
| Data Store | Open-Ended Rectangle or Two Parallel Lines | A location where data is held for later use, such as a file or database table. |
| Data Flow | Arrow | The movement of data between entities, processes, and data stores. |
1. External Entity
An external entity represents a source or destination of data that lies outside the boundaries of the system being modeled. These are typically people, organizations, or other systems that interact with the system but are not themselves part of it.
Example
For a learning platform such as CS Engineering Gyan, external entities might include the Student, who provides login details and receives course content, and the Instructor, who provides video uploads and receives enrollment statistics. Neither of these entities is part of the internal system itself, but both interact with it by sending or receiving data.
2. Process
A process represents an activity or function that transforms input data into output data. Every process in a DFD must have at least one incoming data flow and at least one outgoing data flow, since a process that neither receives nor produces data would have no meaningful purpose within the diagram.
Example
A process labeled Verify Login Credentials might take a username and password as input, check them against stored account information, and produce either a successful login confirmation or an error message as output, representing a clear transformation of incoming data into a meaningful result.
3. Data Store
A data store represents a location where data is held, either temporarily or permanently, for later use by one or more processes. Data stores typically correspond to database tables, files, or other persistent storage mechanisms within the actual system.
Example
A data store labeled Student Records might hold information such as student names, email addresses, and enrollment details, which various processes throughout the CS Engineering Gyan platform read from or write to as students interact with the system.
4. Data Flow
A data flow represents the movement of data between external entities, processes, and data stores, typically shown as a labeled arrow indicating what specific data is being transferred and in which direction.
Example
An arrow labeled Login Credentials flowing from the Student external entity into the Verify Login Credentials process represents the movement of a username and password from the student into the system for validation.
Levels of DFD
Data Flow Diagrams are typically organized into multiple levels, each providing progressively more detail about how a system functions. This layered approach allows a system to be understood at a high level first, before diving into more granular detail where needed.
| Level | Description |
|---|---|
| Context Diagram (Level 0) | Represents the entire system as a single process, showing only its interactions with external entities. |
| Level 1 DFD | Breaks the single process from the context diagram into its major sub-processes. |
| Level 2 DFD and Beyond | Further decomposes individual processes from Level 1 into even more detailed sub-processes, as needed. |
Context Diagram (Level 0)
The context diagram, sometimes called a Level 0 DFD, represents the entire system as a single process, showing only how it interacts with external entities, without revealing any of its internal structure. This provides the broadest possible overview of a system's boundaries.
Example
A context diagram for the CS Engineering Gyan platform might show a single process labeled Learning Platform System, connected to external entities such as Student and Instructor, with data flows such as Login Credentials and Course Content moving between them, without showing any of the internal processes that actually handle these interactions.
Level 1 DFD
A Level 1 DFD takes the single process from the context diagram and breaks it down into its major sub-processes, revealing more detail about how the system actually functions internally, while still keeping each process relatively broad.
Example
Expanding the earlier context diagram, a Level 1 DFD for CS Engineering Gyan might reveal several distinct processes, such as Manage User Authentication, Manage Course Content, and Track Student Progress, each connected to relevant data stores like Student Records and Course Details, along with data flows connecting these processes to the external entities identified earlier.
Level 2 DFD and Further Decomposition
If a particular process from Level 1 still involves significant internal complexity, it can be broken down further into a Level 2 DFD, revealing even more detailed sub-processes within that specific area of the system.
Example
The Track Student Progress process identified in the Level 1 diagram might be expanded further in a Level 2 DFD into more specific sub-processes, such as Calculate Video Completion Percentage and Update Course Completion Status, each handling a more narrowly defined piece of the overall progress-tracking functionality.
This decomposition can continue further if needed, though in practice, most systems rarely require detail beyond Level 2 or Level 3 before the diagrams become detailed enough to guide implementation directly.
Rules for Creating a Valid DFD
To keep Data Flow Diagrams clear, consistent, and logically sound, several widely accepted rules should be followed when constructing them.
| Rule | Explanation |
|---|---|
| Every process must have at least one input and one output. | A process with no input or output has no meaningful role in transforming data. |
| Data cannot flow directly between two external entities. | External entities must interact with the system through a process, not with each other directly. |
| Data cannot flow directly between two data stores. | Data must pass through a process to move from one data store to another. |
| Data cannot flow directly from a data store to an external entity, or vice versa. | A process must always mediate any exchange of data between a data store and an external entity. |
| Each process should be clearly labeled with a descriptive name. | Vague labels make it difficult to understand what a process actually does. |
Step-by-Step Approach to Building a DFD
| Step | Description |
|---|---|
| Identify External Entities | Determine who or what interacts with the system from outside its boundaries. |
| Identify Major Processes | Determine the main activities the system must perform to fulfill its requirements. |
| Identify Data Stores | Determine where data needs to be held for later use within the system. |
| Draw the Context Diagram | Represent the entire system as a single process interacting with external entities. |
| Expand into Level 1 and Beyond | Gradually break the system down into more detailed sub-processes as needed. |
Advantages of Data Flow Diagrams
- Provide a simple, visual way to communicate how data moves through a system without technical jargon.
- Help identify all necessary data stores and processes early in the design phase.
- Support a layered approach, allowing stakeholders to view a system at whatever level of detail is appropriate for them.
- Make it easier to spot missing processes, unclear responsibilities, or redundant data flows before development begins.
- Serve as useful documentation that remains valuable even after the system has been built.
Limitations of Data Flow Diagrams
- They do not show the timing, sequencing, or conditional logic of how processes actually execute.
- They can become difficult to manage for extremely large or complex systems without careful organization into levels.
- They focus purely on data movement, leaving other important aspects like system architecture to be documented separately.
Best Practices for Creating DFDs
- Keep each level of the diagram focused on an appropriate amount of detail, avoiding overly complex individual diagrams.
- Use clear, descriptive labels for every process, data store, and data flow.
- Maintain consistency in naming between different levels, so a process in Level 1 clearly relates to its expanded version in Level 2.
- Validate the diagram against the established DFD rules to catch structural mistakes early.
- Review diagrams with stakeholders to confirm that all necessary data flows and processes have been captured accurately.
Common Mistakes Beginners Make
| Mistake | Correct Practice |
|---|---|
| Showing data flowing directly between two external entities. | Route all such data through an appropriate process within the system. |
| Creating a process with no clear input or output. | Ensure every process transforms at least one input into at least one output. |
| Including control flow elements like decisions or loops in a DFD. | Remember that DFDs represent data movement only, not control logic or sequencing. |
| Jumping straight into a highly detailed diagram without starting from a context diagram. | Begin with a context diagram and progressively add detail through Level 1 and beyond. |
Frequently Asked Questions
-
What is a Data Flow Diagram in software engineering?
A DFD is a visual representation of how data moves through a system, showing processes, data stores, external entities, and data flows. -
What is the difference between a DFD and a flowchart?
A DFD focuses on the movement of data, while a flowchart focuses on the sequence and logic of operations, including decisions and loops. -
What is a context diagram in DFD?
A context diagram, or Level 0 DFD, represents the entire system as a single process interacting with external entities. -
Can data flow directly between two external entities in a DFD?
No, data must always pass through a process rather than flowing directly between two external entities. -
What does a data store represent in a DFD?
A data store represents a location where data is held for later use, such as a database table or file. -
Why must every process have at least one input and one output?
Because a process is meant to transform data, and without both an input and an output, it would serve no meaningful purpose. -
How many levels can a DFD have?
A DFD can be decomposed into as many levels as needed, though most practical systems rarely require detail beyond Level 2 or Level 3. -
What are the main benefits of using a DFD during software design?
DFDs provide a clear visual overview of data movement, help identify missing processes early, and support communication between technical and non-technical stakeholders.
Summary
Data Flow Diagrams offer a clear, visual way to represent how information moves through a system, using a simple set of symbols representing external entities, processes, data stores, and data flows. Starting from a broad context diagram and gradually expanding into more detailed levels allows teams to understand a system, such as a platform like CS Engineering Gyan, at whatever depth is appropriate for a given discussion.
Following established rules, such as ensuring every process has both an input and an output, and never allowing data to flow directly between two external entities or two data stores, keeps these diagrams logically consistent and genuinely useful throughout the design process. Well-constructed DFDs make it far easier to spot missing functionality or unclear data handling before development begins.
With a solid understanding of Data Flow Diagrams, you are now ready to explore Entity Relationship Diagrams, which shift focus from data movement to the structural relationships between the different pieces of data a system needs to store.